Kick tolerance is the maximum gas volume for a given degree of underbalance which the circulation can be performed without exceeding the weakest formation in the wellbore. This article is the extended version of Kick Tolerance Calculation which will explain more on this topic. It is very critical that drilling personnel understand its importance to well design and drilling operation.

There are two important factors used for determining the kick tolerance
• Kick Intensity – It is the different between the maximum anticipated formation pressure and planned mud weight. For example, the planned mud weight is 13.0 ppg and the possible kick pressure is 13.5 ppg. Therefore, the kick intensity is 0.5 ppg (13.5 – 13.0).
A zero kick intensity (swabbed kick scenario) should be used for a know area where you have less uncertainty about an overpressure zone.
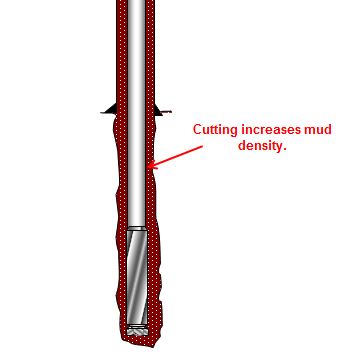
• Kick Volume – It is a gas influx entering into the wellbore from the formation. Gas kick is always used for well control calculation because it is the worst case scenario. The kick volume should be realistic figure which personal can detect the influx on the rig. In a larger hole, it allows bigger influx volume than a small hole.
Continue reading →


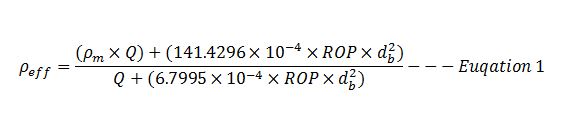
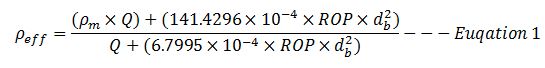
 Figure 1 – Max ROP before Fracturing Formation