


Casing and tubing selection are one of the critical tasks that engineers must carefully decide which type of casing/tubing will be used in the wellbore in order to meet the objective of each well. I would like to share my knowledge about the selection criteria for casing/tubing string design.
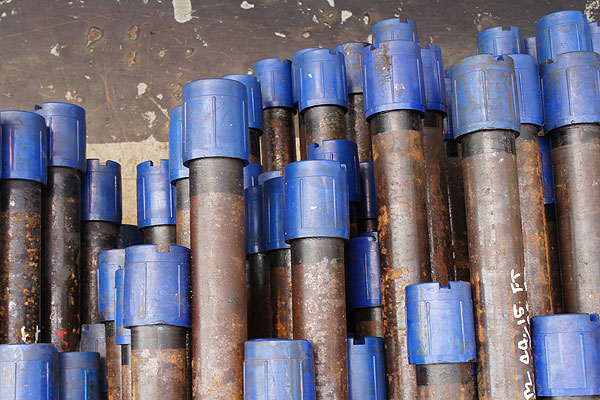
Oilfield Tubing
The factors must be contemplated when designing a casing and/or tubing string as listed below;
• Reservoir fluid type (oil, gas, or combine)
• Depth of casing and tubing string
• Formation Pressure gradient and fracture gradient
• Reservoir temperature
• How much reserves of reservoir
• How long of production life of wells
• Economic consideration
• Strategy of completion technique as conventional completion, monobore completion, monobore horizontal completion, etc.
• Production plan as production rate, how plateau rate be maintained, secondary recovery plan, etc.
• Bottom hole reservoir pressure and expected surface pressure during future production plan
• Level of sour gas as H2S and CO2
• Hydrocarbon zones are required to be covered by cement
• Tubing size needed to achieve production and stimulation plan
• Artificial lift equipment requirements
• Future workover plan
• Physical property of material
• Clearances needed for fishing
• Type of connection
If you have any more considerations, please feel free to share : )


